Bitcoin’s Stock-to-Flow Model: What Lies Ahead for the World’s Largest Cryptocurrency?
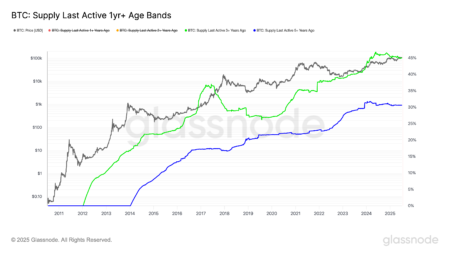
As Bitcoin [BTC] hovers near its all-time high (ATH), market participants are eager to determine the cryptocurrency’s next move. According to the Bitcoin Stock-to-Flow (S2F) model, there is still plenty of upside potential in the current cycle. Historically, Bitcoin’s price trajectory has closely followed the S2F curve, which presently indicates that we may be on the cusp of a significant price increase. With Bitcoin still trading below predicted trends, it suggests the cycle peak has yet to be reached. If historical patterns repeat, we could see substantial gains before arriving at that peak.
Bullish Signals Abound
Recent indicators suggest that Bitcoin’s market sentiment has turned increasingly bullish. The cryptocurrency has successfully broken above a long-term downtrend that had acted as a significant barrier since late 2024. Following this breakout, Bitcoin retested the $100K level as support not once but twice, reinforcing the breakout’s legitimacy. Accompanying this price action, a notable MACD (Moving Average Convergence Divergence) reversal occurred, marked by the MACD line crossing above the Signal line three times within the last three months. Historically, these crossovers have typically signaled uptrends. The latest MACD crossover aligns with the thrust upward to $109K, further bolstering the bullish sentiment across the board.
Assessing Market Sentiment
The interplay of various indicators points to a diminishing selling pressure, contrasting sharply with earlier selling trends. This change in sentiment implies that market dynamics may have shifted in favor of bulls. Given the current momentum, Bitcoin stands a good chance of revisiting old highs and potentially breaking through to new price territories. Analysts suggest that understanding on-chain movements and other macroeconomic indicators is key to predicting the cryptocurrency’s trajectory in both the short and medium-term.
Liquidity Plays a Crucial Role
In addition to positive price indicators, rising global liquidity presents another favorable condition for Bitcoin. The M2 money supply chart, a common precursor to Bitcoin rallies, shows a sharp increase in liquidity. Currently, Bitcoin’s dislocation behind M2 by approximately 11 weeks suggests that the cryptocurrency market may be nearing a catch-up phase. As long as liquidity continues to trend upward, a bulls’ market may be on the horizon.
Increased Buying Activity
Supporting this bullish outlook, data from Binance indicates a rise in net taker volume exceeding $100 million, according to CryptoQuant. This uptick hints at strong buying activity ahead of critical indicators like the U.S. Non-farm Payrolls data. Historical trends highlight that Bitcoin could maintain a steady ascent in tandem with M2 liquidity. However, concerns about investor apprehension remain. The presence of an extended liquidity decompression and forceful macroeconomic cues could trigger a renewed Bitcoin surge.
Conclusion: The Road Ahead
In summary, numerous indicators point to a potentially bullish trend for Bitcoin as it approaches its ATH. The Stock-to-Flow model still forecasts that significant price increases lie ahead. Coupled with improved market sentiment, rising liquidity, and substantial buying activity, Bitcoin may be perfectly positioned for a breakout to new heights. As investors keep a close eye on macroeconomic trends and on-chain movements, the future seems promising for Bitcoin enthusiasts. A thoughtful analysis of these dynamics will be essential to navigate the evolving landscape of cryptocurrency in 2023 and beyond.


