Understanding XRP’s Current Market Dynamics: A Look at Recent Trends
In recent weeks, XRP has demonstrated significant market movements, notably marked by high outflows from exchanges. This is viewed as a bullish sign, indicating that investors are accumulating the asset despite falling network activity and diminishing retail interest. Such outflows often signal growing demand, which could lead to a potential upward momentum for XRP in the near future.
Accumulation Indicators and Resistance Levels
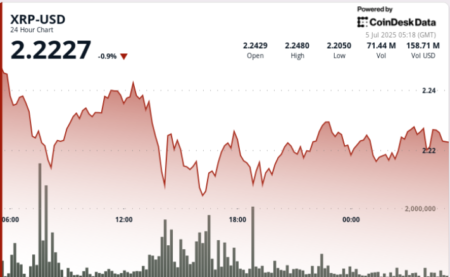
On July 3rd, XRP bulls attempted to break through the crucial resistance zone of $2.3. Technical analysis revealed that the mid-range resistance is closely tied to this threshold, hovering around $2.27. Since March, XRP has been trading within this specific range, facing challenges in crossing substantial resistance levels. A pivotal observation was that over 1 billion tokens were moved off exchanges, suggesting accumulation efforts from investors. However, despite these bullish indicators, XRP continues to face legal hurdles, particularly in its ongoing legal battles with the Securities and Exchange Commission (SEC) and other entities, which may hinder its potential price breakout.
Navigating XRP’s Price Dynamics
From a broader perspective, the weekly chart shows that XRP’s overall swing structure appears bullish, particularly following a strong rally in November that established a higher low at $1.61. Yet, the internal market structure has shifted bearish, with the $2.60 resistance zone rejecting bullish attempts since March, indicating that further upward movement is not guaranteed. Notably, trading volume has been on a steady decline since February, reflecting a consolidation phase for XRP, which may lead to fluctuating price dynamics in the upcoming weeks.
Importance of Key Resistance Levels
Examining the daily chart reveals that the $2.27–$2.32 supply zone has served as a critical resistance level throughout June. The bulls have yet to successfully break above this zone. Currently, the On-Balance Volume (OBV) has trended downward, signaling weakening demand despite a recent increase in interest over the past week. The Relative Strength Index (RSI), however, has surpassed the neutral 50 mark, indicating a potential buildup of bullish momentum. Swing traders may find it favorable to consider long positions if XRP can successfully retest $2.32 as a support level in subsequent trading sessions.
Retail Investor Sentiment and Network Activity
Despite the recent positive price action, a sharp decline in transaction activity suggests waning interest from retail investors. The Network Value to Transactions (NVT) ratio reflects low on-chain activity, raising concerns about the effectiveness of network usage. This decline may serve as a cautionary indicator for potential investors, highlighting the need to observe both technical and fundamental developments in the market.
Conclusion: The Path Ahead for XRP
In conclusion, while XRP displays some promising signs, such as healthy outflows and potential accumulation, it remains tethered to challenging resistance levels and ongoing legal disputes. Investors should approach with caution, monitoring both technical indicators and broader market trends to inform their strategies. As XRP navigates these complexities, the interplay of accumulation, network activity, and retail interest will play a crucial role in determining its future price movement. By keeping an eye on these factors, investors can better position themselves for possible opportunities within the crypto market.
Disclaimer: The information provided in this article does not constitute financial, investment, trading, or other forms of advice. It is solely the author’s opinion based on current market observations. Always conduct your independent research before making any investment decisions.

