


The Recent Dip in Cosmos’ ATOM Token: Analyzing Market Trends and Technical Indicators
The cryptocurrency market is known for its high volatility, with prices fluctuating significantly over short periods. Recently, the Cosmos’ ATOM token faced a decline of 4% in the last 24 hours, reflecting a broader trend seen across the crypto landscape. As traders and investors navigated the complexities of the market, technical indicators revealed critical insights into the challenges facing ATOM and other assets.
The Market Context
On Thursday, July 4th, there was a temporary rally in the cryptocurrency market, with Bitcoin making an attempt to reach new heights but ultimately retreating from $111,000 to $108,000. This inability to break through previous highs impacted altcoins, including ATOM, which followed Bitcoin’s lead and encountered significant selling pressure. As the day progressed, the optimism that fueled the mid-week surge dissipated, leading to a return to bearish momentum on Friday, potentially exacerbated by lower market activity due to the U.S. July 4th holiday.
Technical Analysis of ATOM
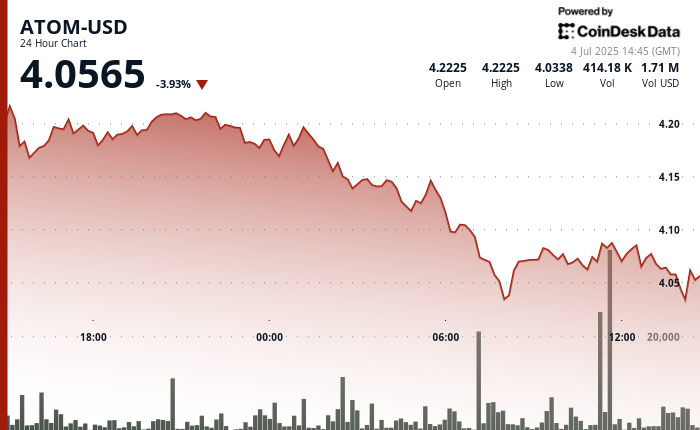
During a 24-hour timeframe from July 3rd, 15:00 to July 4th, 14:00, ATOM-USD experienced a marked decline of $0.17 (3.95%), falling from $4.22 to $4.06. This downward trend followed a failure to maintain crucial support at $4.17, with subsequent high-volume selling at the $4.09 level. A significant selling volume of 588,338 units was recorded during the hour preceding July 4th at 7:00 AM, well above the 24-hour average.
Further evidence of the asset’s struggle was observed through multiple rejections at the $4.07 support level, confirming an ongoing bearish trend as technical indicators suggested that the price action exhibited lower highs and lower lows, an indication of persistent downward price pressure.
Cryptocurrency Market Sentiment
The CD20 index, which tracks the overall sentiment in the crypto market, also reflected a bearish sentiment in conjunction with ATOM’s decline. The index plummeted 2.13% over the same 24-hour period, falling from $1,803.70 to $1,765.27, representing a significant drop of $38.43. The index showcased continued selling pressure, with the lowest point recorded at $1,764.86 at 14:00 on July 4th. Despite occasional attempts at recovery around the $1,780 mark, these efforts were short-lived as negative sentiment prevailed across the market.
Identifying Technical Patterns
From a technical perspective, ATOM’s price chart indicates a trend of declining prices leading to the critical psychological support level of $4.00. This key level has historically served as a significant marker for traders and investors. The pattern formed by the price action, along with the aforementioned indicators, shows that ATOM is at risk of further declines if selling pressures continue. The market sentiment surrounding ATOM, intertwined with broader market dynamics, suggests caution among investors.
Implications for Investors
For investors, understanding the technical indicators and market sentiment is vital. The current bearish landscape may present opportunities for strategic entry points if the price dips further, but it also carries risks as macroeconomic factors and investor behavior come into play. Careful monitoring of support and resistance levels, as well as broader market trends, will be crucial for those looking to invest in ATOM or similar cryptocurrencies during this uncertain market period.
Conclusion
The recent slump in Cosmos’ ATOM token reflects the volatile nature of the cryptocurrency market, driven by broader trends in Bitcoin and overall market sentiment. Technical indicators paint a clear picture of the bearish momentum facing ATOM ahead of crucial support levels. Investors will need to navigate these challenges with caution, balancing potential opportunities against market risks. By remaining informed and vigilant, traders can better position themselves to respond to evolving market dynamics.


