

 in Its National Crypto Reserve")


Bitcoin Market Analysis: Key Levels and Insights
Bitcoin has recently entered a phase of consolidation, trading below significant breakout thresholds. As of 08:00 UTC on October 25, BTC was caught in a narrow band, signaling a balance between buyers and sellers while hovering around critical support and resistance levels. Understanding these dynamics is vital for traders and investors aiming to navigate the volatile cryptocurrency market.
Current Price Action and Session Overview
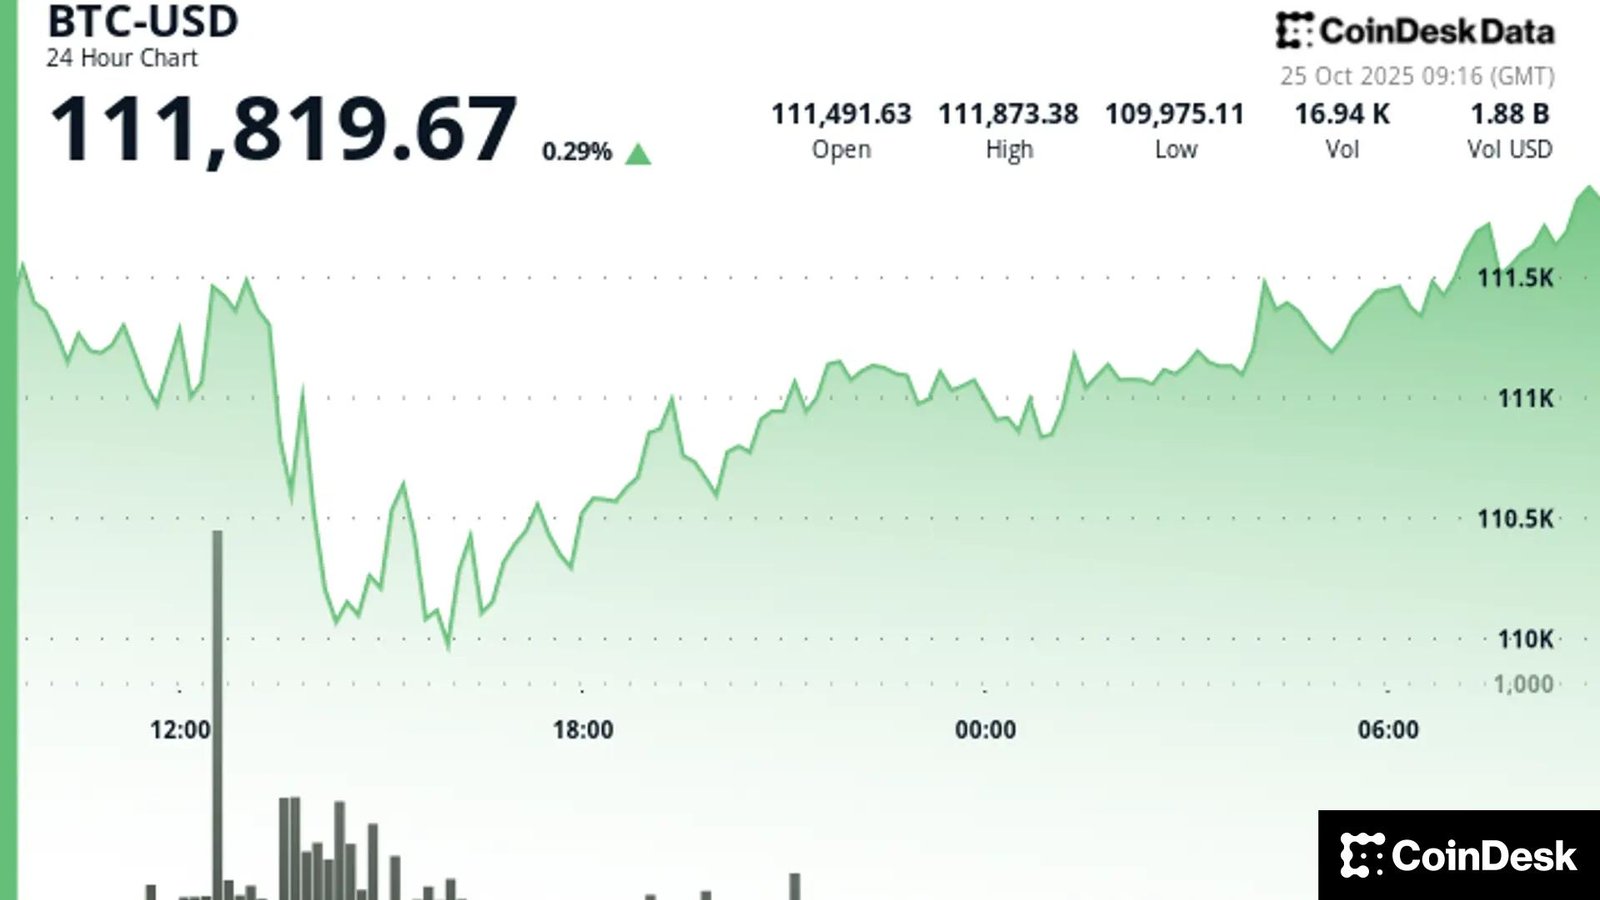
During the 24 hours leading up to October 25 at 08:00 UTC, Bitcoin moved from $111,157 to $111,634, maintaining a tight trading range of approximately $2,025 or 1.8%. This tight trading corridor sees resistance formed between $111,800 and $111,900, while major support rests at approximately $109,800. With no clear catalyst pushing the price decisively in either direction, Bitcoin’s trading behavior can be characterized as cautious and measured.
Volume Insights and Trading Patterns
Trading volume provides additional context to Bitcoin’s recent price action. On October 24, volume peaked around 14:00 UTC, reaching 23,728 BTC—significantly higher than the 24-hour average of 8,200 BTC. This surge coincided with Bitcoin’s price pressing into the $109,818 region, where it eventually stabilized. However, as the day progressed, trading activity cooled, easing from $111,745 to $111,545, which indicates that the market is currently in a period of consolidation, as demonstrated by the dwindling turnover rates.
Technical Levels to Watch
Investors should focus on two major levels in the near term. A clean break and sustained close above the $112,000 mark could shift bullish sentiment, with the next target positioned at $115,000. Conversely, if Bitcoin loses the $109,800 support level, a deeper pullback could see prices gravitate toward $108,000. Understanding these technical levels will be essential for traders looking to capitalize on potential breakouts or reversals.
CoinDesk 5 Index (CD5) Analysis
The CoinDesk 5 Index (CD5), a measure of major crypto assets, reflects mixed momentum. Within the same timeframe, CD5 rebounded intraday from 1,920.75 to 1,961.57, settling at 1,940.94. Since it remains just below the critical 1,950 level, market participants should monitor this index as it could provide broader insights into market trends affecting Bitcoin and altcoins.
Moving Averages as Guidance
According to CoinDesk Research’s technical analysis data model, the 200-day moving average sits near $108,000, while the 100-day moving average is around $115,000. These moving averages serve as reference points for traders assessing Bitcoin’s longer-term trend. A sustained break below the 200-day moving average could trigger further selling pressure, whereas trading above the 100-day average would solidify positive sentiment.
Concluding Thoughts
In conclusion, Bitcoin is currently navigating through a phase of tight trading, marked by clear support and resistance levels. As traders prepare for potential breakouts or breakdowns, it is crucial to maintain awareness of volume trends, key technical levels, and broader market indicators like the CD5 index and moving averages. Staying informed and proactive can help investors make calculated decisions in this ever-evolving cryptocurrency landscape.


