


 Due to Bitcoin (BTC) Exposure and Cash Burn Concerns")


Chainlink (LINK) Price Analysis: An Optimistic Outlook Amid Caution
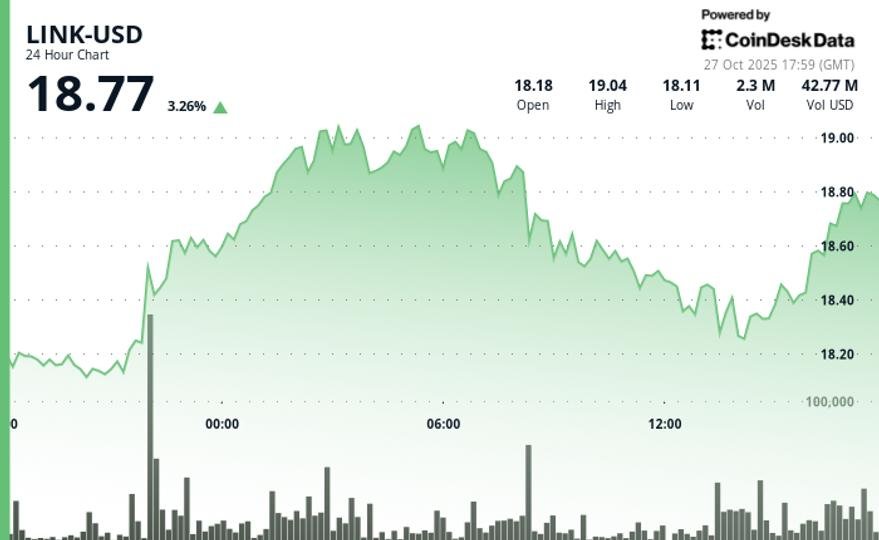
Chainlink’s native token, LINK, has exhibited notable performance recently, climbing from $18.30 to $18.80, despite setbacks experienced in October. This article delves into the factors contributing to the bullish trend, technical indicators, and what investors should be aware of moving forward.
Growing Accumulation by Whales
The recent price movement has attracted significant attention from large holders, commonly referred to as whales. Data from blockchain analytics firm Lookonchain reveals that since the market’s downturn on October 11, whales have withdrawn approximately 10 million LINK tokens from the Binance exchange, valued around $188 million at current prices. This accumulation trend suggests that seasoned investors are positioning themselves favorably despite the market’s volatility.
Technical Resilience and Market Performance
Technical analysis indicates that LINK has maintained a series of higher lows, with established support levels at $18.10 and $18.42. This price structure signifies a bullish sentiment, particularly after breaking the crucial resistance point of $18.70, supported by a volume increase to 3.07 million. Interestingly, LINK’s performance has outpaced the broader cryptocurrency market, which speaks to its resilience and potential for future growth.
Volume Considerations: A Cautionary Note
Despite the positive price movement, it’s essential to approach this trend with caution. The trading volume has remained approximately 5% below the weekly average, indicating that institutional participation may be limited. The divergence in price advancement coupled with stagnant trading volume raises red flags for investors, suggesting that enthusiasm may not yet be fully supported by market engagement.
Key Support and Resistance Levels
In any technical analysis, understanding support and resistance levels is critical. For Chainlink, strong support has formed around $18.24, while resistance persists in the $18.70 to $18.75 range. As the market pushes higher, the immediate upside target is set at the $20.04 resistance level. However, should momentum falter, the price may retract toward the $18.10 support. Keeping an eye on these levels will be essential for making informed trading decisions.
Chart Patterns: Future Projections
The overarching chart patterns suggest a sustained ascending channel structure established since mid-2023. The recent bounce from the lower boundary reinforces the constructive outlook for Chainlink’s price. However, traders should remain vigilant for signs of potential reversals, especially as LINK approaches resistance levels. A careful analysis of price action in these zones will be critical for predicting next moves.
Conclusion: Navigating Market Volatility
In conclusion, while Chainlink’s recent price movements have been impressive, marked by significant accumulation from whales and a bullish structure, caution is warranted due to underlying trading volume trends. Investors should closely monitor key support and resistance levels as well as market sentiment to navigate the inevitable volatility in the cryptocurrency landscape. Staying informed and adopting a cautious approach will be paramount for those looking to capitalize on potential gains while minimizing risks.


 Due to Bitcoin (BTC) Exposure and Cash Burn Concerns")


, Hedera (HBAR), and Litecoin (LTC) This Week")

 Sells ETH to Finance Buybacks")