


Hedera Hashgraph (HBAR): Analyzing Recent Price Movements and Market Trends
Introduction
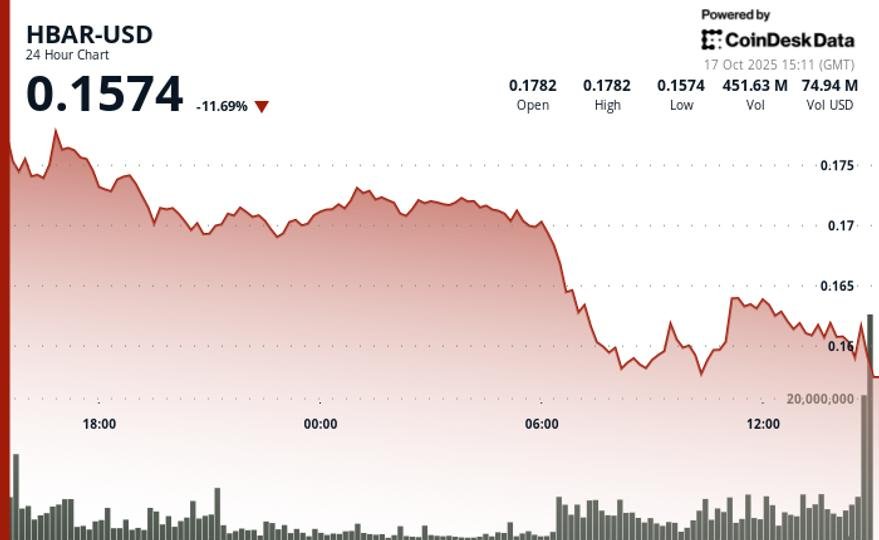
In the world of cryptocurrency, volatility is a common occurrence, and Hedera Hashgraph (HBAR) has recently demonstrated this with a significant price drop. Between October 16, 15:00 and October 17, 14:00, HBAR fell sharply from $0.18 to $0.16, representing an 11.15% decline. This drop occurred within a trading range of 12.74%, indicating an active yet turbulent market environment. In analyzing the recent market activity, we can gain insights into HBAR’s current standing and what factors may influence its future performance.
Price Analysis and Key Levels
HBAR experienced its heaviest selling between 06:00 and 08:00 on October 17, leading to a decline from $0.17 to $0.16 with significant trading volume. This price point at $0.17 proved to be a formidable resistance level, suggesting that buyers are hesitant to push beyond it. In contrast, HBAR found support around the $0.16 mark, where multiple rebounds have occurred. Despite these rebounds, the asset continues to show a bearish pattern characterized by lower highs, indicating persistent selling pressure.
Trading Volume Insights
The trading volume further emphasizes the market’s fragility. During peak selling pressure, volume surged to 175.12 million, illustrating a high level of activity among traders. This volume spike highlights the market’s sensitivity to price fluctuations and the quick actions taken by traders in response. Interestingly, despite the price decline, the final hour of trading saw a rebound attempt at the $0.16 level, with volume exceeding 4 million. This suggests that while the overall trend remains bearish, there may be temporary stabilization efforts from traders looking to capitalize on the price dip.
Broader Market Context
HBAR’s recent price action is reflective of broader market dynamics impacting cryptocurrencies. Market weakness and intensified selling pressure have become key themes across various digital assets. This weakening sentiment is partly influenced by external economic factors, affecting trader psychology and impacting decisions across the crypto landscape. Hence, HBAR’s downturn must be viewed in the context of a larger trend affecting many cryptocurrencies, further complicating predictions for short-term recovery.
Technical Indicators and Future Outlook
Examining technical indicators reveals ongoing market fragility for HBAR. With evidence of robust resistance at the $0.17 threshold and confirmed support around $0.16, traders are closely monitoring these levels. The persistent pattern of lower peaks suggests that unless significant buying pressure emerges to break through resistance, HBAR will likely continue to face downward pressure. While short-term recovery attempts may be possible, consolidation within the $0.16 range could precede any meaningful reversal.
Conclusion
In summary, HBAR’s dramatic price drop and subsequent trading dynamics reveal important insights into its market position. The technical analysis highlights key resistance and support levels, while broader market trends underscore the challenges that digital assets currently face. As traders remain vigilant, understanding these market movements will be crucial for making informed investment decisions. Future performance for HBAR will likely hinge on its ability to stabilize and build buying momentum against ongoing bearish pressures.


