


HBAR Price Analysis: Understanding the Recent Bearish Trend
Introduction to HBAR’s Performance
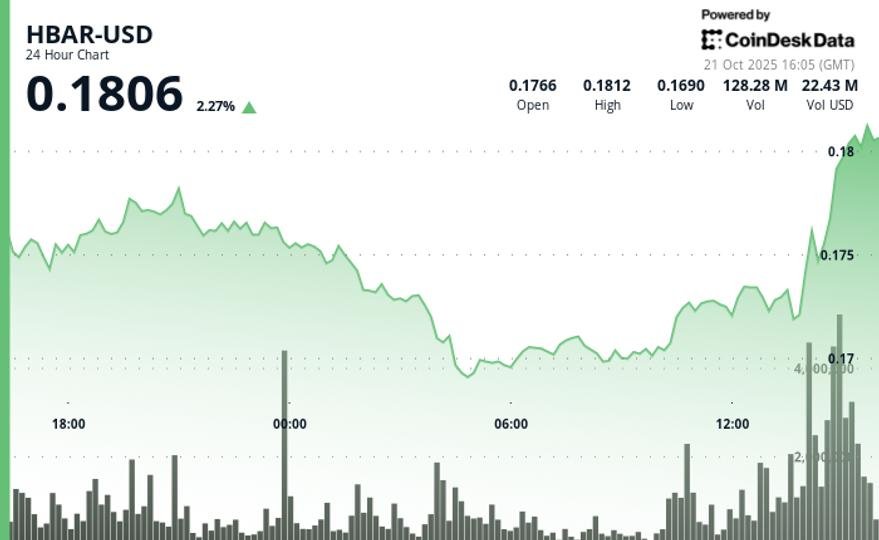
In the recent trading session, HBAR, the native cryptocurrency of the Hedera Hashgraph, plummeted by 4.3%, dropping from $0.1802 to $0.1725. This decline was predominantly driven by heavy selling activities during the Asian trading hours, where pivotal support levels were breached, indicating a notable shift in market sentiment. As the price fluctuated, it established lower highs and lows, marking a definitive bearish trend that resulted in price consolidation within a narrow range of just $0.0120.
Significant Volume and Institutional Influence
The morning saw a dramatic spike in trading volume, increasing by 71% above the daily average, with approximately 67.16 million tokens transacted at around 04:00 GMT. This surge was directly correlated with HBAR’s breach of the critical $0.1720 support zone, suggesting that institutional investors played a significant role in the selloff. Despite a brief dip to $0.1688, trading momentum soon softened, leading to decreased volume as the session progressed, which indicated that the initial selling pressure had begun to ease.
Late Session Recovery Attempts
As the trading session continued, HBAR managed to execute a sharp recovery, ultimately closing the day up by 1.2% at $0.1745. This late-session increase was spurred by a notable surge of 3.55 million tokens traded in a short lapse, suggesting pockets of strong buying interest amid the bearish sentiment. However, even with this bounce back, there remained uncertainty regarding its sustainability, particularly given the fading momentum approaching the resistance level of $0.1745.
Technical Levels and Market Dynamics
The current technical analysis of HBAR shows conflicting momentum, where key resistance and support levels provide insight into immediate market behavior. The late-session attempt to breach the $0.1726 resistance was seen, but the earlier violation of the $0.1720 support during high-volume trading illustrated a looming bearish outlook. Moreover, the session’s low near $0.1688 may serve as a temporary floor, while immediate resistance at $0.1745 poses a significant challenge to any potential upward movement.
Volume Insights and Chart Patterns
Diving deeper into volume analytics, the morning’s spike confirmed the breakdown of support levels, driven predominantly by institutional trading behavior. The subsequent recovery was supported by a notable influx of buying pressure; however, volume exhaustion at the psychological $0.1745 cap indicated that traders should remain cautious. The overarching bearish structure of lower highs and lows leaves room for further price declines unless a reversal signals otherwise.
Conclusion: Navigating HBAR’s Market Trends
As HBAR grapples with a bearish market structure, traders are encouraged to be vigilant as the token oscillates within a trading range of $0.1688 to $0.1745. The current market dynamics suggest an ongoing period of range trading until a significant increase in trading volume can lead to more definitive price action. Understanding these trends and the influence of institutional participation will be critical for traders aiming to navigate HBAR’s performance effectively.


